EXPERIMENTS on Mutant plants |
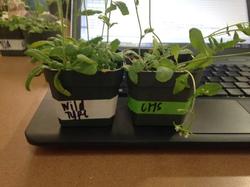
I am currently working on this project. For this I observed the effects the Tobacco Mosaic Virus has on wild type (non-altered) Arabidopsis as well as CHS mutated Arabidopsis.
|
Testing The effect of The Tobacco mosaic virus on Wild And CHs mutated Arabidopsis
Introduction
Experiments on plants are commonly done throughout the world. A common example of experimentally modified plants are GMO’s (Genetically Modified Organisms) which are mainly found in crops. Scientist modify crops genome in order to improve the organism. For instance, plants that would normally die under certain situations/environments can be altered to survive them. This is not only beneficial to the plant, but it is to humans and animals as it rises the number of plants that can be consumed. If both animal and human populations continue to grow, the amount of food per person would drop drastically and we could even experience an international food shortage. However, if we can help ensure that every crop grown were to survive under stress conditions such as possible viruses and harsh/strange lighting conditions, we can better maintain the amount of food per person as the population continues to grow.
One mutation that is responsible for helping plants survive unusual conditions is the chalcone synthase (CHS) mutation. CHS is a part of the genome that is often turned on to help the plant survive different stress conditions. Meaning that a CHS Mutated plant should be able to protect itself when introduced to a virus, or other stressful conditions.
In our attempt to increase our understanding of the ways the CHS mutation can be used as a defensive system for the plant, we decided we will be using a wild type (non-altered), and a CHS Mutated type of the plant Arabidopsis. Arabidopsis is commonly used in experiments as it has many advantages for genome analysis such as: a short generation time, small size, large number of offspring, and a relatively small nuclear genome. These advantages promote the experiment as we can receive results quickly and easily.
I predict that when both the CHS Mutated Arabidopsis and the Wild Type Arabidopsis are introduced to a virus the CHS Mutated plant will be affected, but end up surviving, and thriving while the Wild Type, which does have the ability to fight off viruses well, will take it much harder and end up dying to do the virus.
If CHS shows the predict results and thrives even when a virus is being added to it, all crops could be CHS modified to help the overall crop outcome in every harvest. Not only would this support scientists and farmers in maintaining the food per person, but also support our ecosystem, as well as oxygen supply as plants produce the oxygen we use to breath.
Materials
Methods
First, we seeded all four pots by putting the seeds into agrose and distributing them throughout soiled pots, and allowed them to germinate under a humidity dome for 3-5 days. Once the plants germinated, we narrowed down the amount of plants in each pot to six. We then allowed them to continue growing under fluorescent lights, and bottom watered the plants 2-3 times a week letting them soak for 5 minutes. While this was concurring we also recorded the plants' rosette width and made observations on the phenotype of the plants to determine a basis for the plants before we began treatment.
After 21 days we began experimentation. We kept all variables the same, lighting, watering, soil, ex.. but instead of watering with your average water, my partner and I watered our experimental plants with Tobacco soaked water (.5 grams of tobacco per 40 ml of water soaked for an hour). The remaining two plants, our controls, were kept completely the same as before, watered with regular water. In the beginning we bottom watered all four plants, 40ml each, 2 times a week, all for 10 minutes at a time. But as they continued to grow we began top watering them, 40ml a week, 3 days a week. While we did this we continued to document measurements and observations. Especially on any changes we saw between the plants and why that might be.
Our experiments controlled variables are soil, water, light, and the number of plants. Soil is controlled by insuring an equal amount of soil in each of the potted plants (this is done by equaling the weight of the pots with soil). Water is controlled by insuring the same amount of wetness in the soil by adding the correct amount of water based on the total weight of the filled pot. Light is controlled by keeping all plants in the center below the light beam (where the most light is). And the number of plants is controlled by equaling out the number of plants in the pots once they have sprouted. For this experiment we are equally each pot to 6 plants.
The Independent Variable in our experiment (input/cause) is the mutation and experiment, while the dependent variable (output/effect) is the size, color, texture, angles, and missing parts of our final plants. We can be confident in our results because of our controlled variables, as well as the number of trials. Since we have 6 different plants, they are considered to be 6 different trials. Our media partners also have 6 different trials (plants) done basically the same as ours (controlled variables may differ from ours) that we can compare to ours to increase our trial number to 12.
Results
To view all of our data collection click here
To view our photo gallery of the plants taken each day we collected data, click here
Experiments on plants are commonly done throughout the world. A common example of experimentally modified plants are GMO’s (Genetically Modified Organisms) which are mainly found in crops. Scientist modify crops genome in order to improve the organism. For instance, plants that would normally die under certain situations/environments can be altered to survive them. This is not only beneficial to the plant, but it is to humans and animals as it rises the number of plants that can be consumed. If both animal and human populations continue to grow, the amount of food per person would drop drastically and we could even experience an international food shortage. However, if we can help ensure that every crop grown were to survive under stress conditions such as possible viruses and harsh/strange lighting conditions, we can better maintain the amount of food per person as the population continues to grow.
One mutation that is responsible for helping plants survive unusual conditions is the chalcone synthase (CHS) mutation. CHS is a part of the genome that is often turned on to help the plant survive different stress conditions. Meaning that a CHS Mutated plant should be able to protect itself when introduced to a virus, or other stressful conditions.
In our attempt to increase our understanding of the ways the CHS mutation can be used as a defensive system for the plant, we decided we will be using a wild type (non-altered), and a CHS Mutated type of the plant Arabidopsis. Arabidopsis is commonly used in experiments as it has many advantages for genome analysis such as: a short generation time, small size, large number of offspring, and a relatively small nuclear genome. These advantages promote the experiment as we can receive results quickly and easily.
I predict that when both the CHS Mutated Arabidopsis and the Wild Type Arabidopsis are introduced to a virus the CHS Mutated plant will be affected, but end up surviving, and thriving while the Wild Type, which does have the ability to fight off viruses well, will take it much harder and end up dying to do the virus.
If CHS shows the predict results and thrives even when a virus is being added to it, all crops could be CHS modified to help the overall crop outcome in every harvest. Not only would this support scientists and farmers in maintaining the food per person, but also support our ecosystem, as well as oxygen supply as plants produce the oxygen we use to breath.
Materials
- Wild-type seeds
- CHS mutant seeds
- 0.1% agarose (for cold treatment)
- 4 small pots (2” square)
- Soil w/ fertilizer
- Water
- Fluorescent Lights
- Large tray w/ holes (shared)
- Large tray w/o holes (shared)
- Humidity dome (shared)
- Tobacco Pieces
Methods
First, we seeded all four pots by putting the seeds into agrose and distributing them throughout soiled pots, and allowed them to germinate under a humidity dome for 3-5 days. Once the plants germinated, we narrowed down the amount of plants in each pot to six. We then allowed them to continue growing under fluorescent lights, and bottom watered the plants 2-3 times a week letting them soak for 5 minutes. While this was concurring we also recorded the plants' rosette width and made observations on the phenotype of the plants to determine a basis for the plants before we began treatment.
After 21 days we began experimentation. We kept all variables the same, lighting, watering, soil, ex.. but instead of watering with your average water, my partner and I watered our experimental plants with Tobacco soaked water (.5 grams of tobacco per 40 ml of water soaked for an hour). The remaining two plants, our controls, were kept completely the same as before, watered with regular water. In the beginning we bottom watered all four plants, 40ml each, 2 times a week, all for 10 minutes at a time. But as they continued to grow we began top watering them, 40ml a week, 3 days a week. While we did this we continued to document measurements and observations. Especially on any changes we saw between the plants and why that might be.
Our experiments controlled variables are soil, water, light, and the number of plants. Soil is controlled by insuring an equal amount of soil in each of the potted plants (this is done by equaling the weight of the pots with soil). Water is controlled by insuring the same amount of wetness in the soil by adding the correct amount of water based on the total weight of the filled pot. Light is controlled by keeping all plants in the center below the light beam (where the most light is). And the number of plants is controlled by equaling out the number of plants in the pots once they have sprouted. For this experiment we are equally each pot to 6 plants.
The Independent Variable in our experiment (input/cause) is the mutation and experiment, while the dependent variable (output/effect) is the size, color, texture, angles, and missing parts of our final plants. We can be confident in our results because of our controlled variables, as well as the number of trials. Since we have 6 different plants, they are considered to be 6 different trials. Our media partners also have 6 different trials (plants) done basically the same as ours (controlled variables may differ from ours) that we can compare to ours to increase our trial number to 12.
Results
To view all of our data collection click here
To view our photo gallery of the plants taken each day we collected data, click here
figure 1:
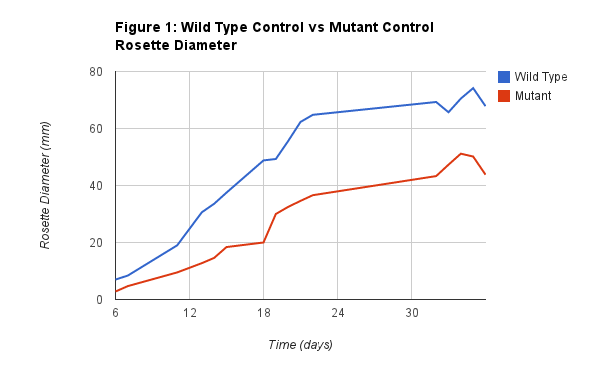
figure 2: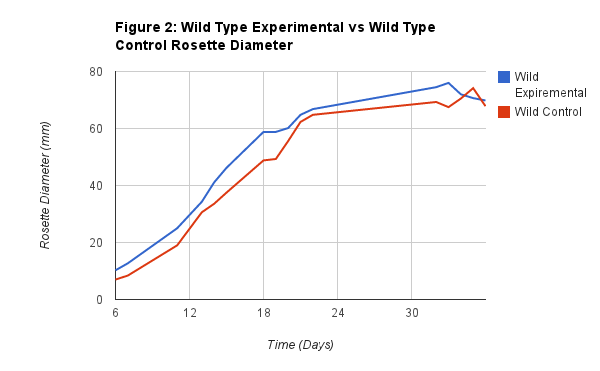
figure 3: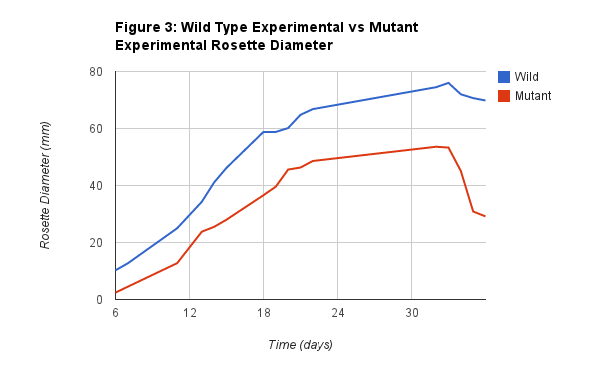
Figure 4: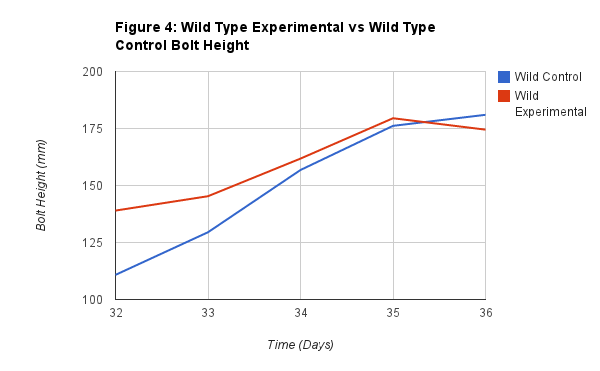
figure 5: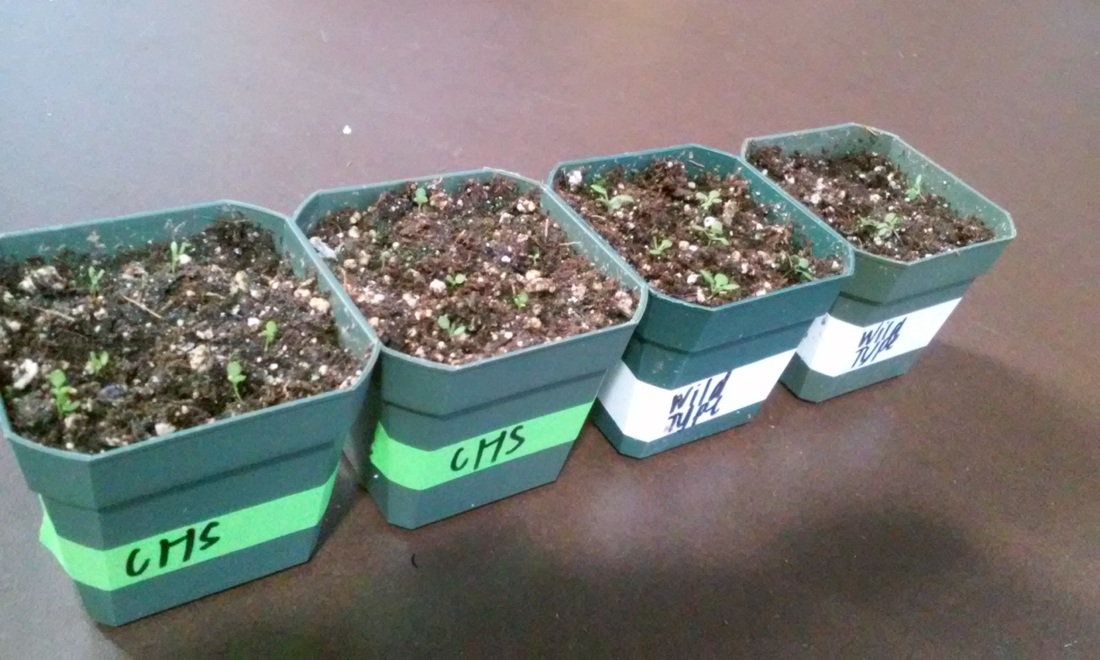
Figure 6: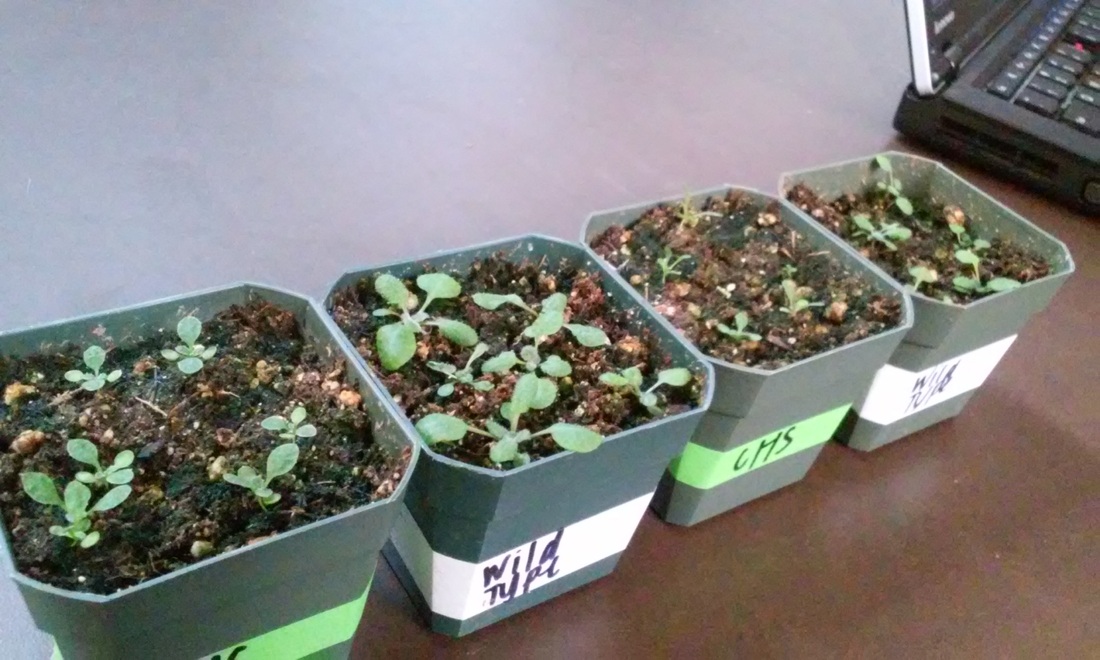
Figure 7: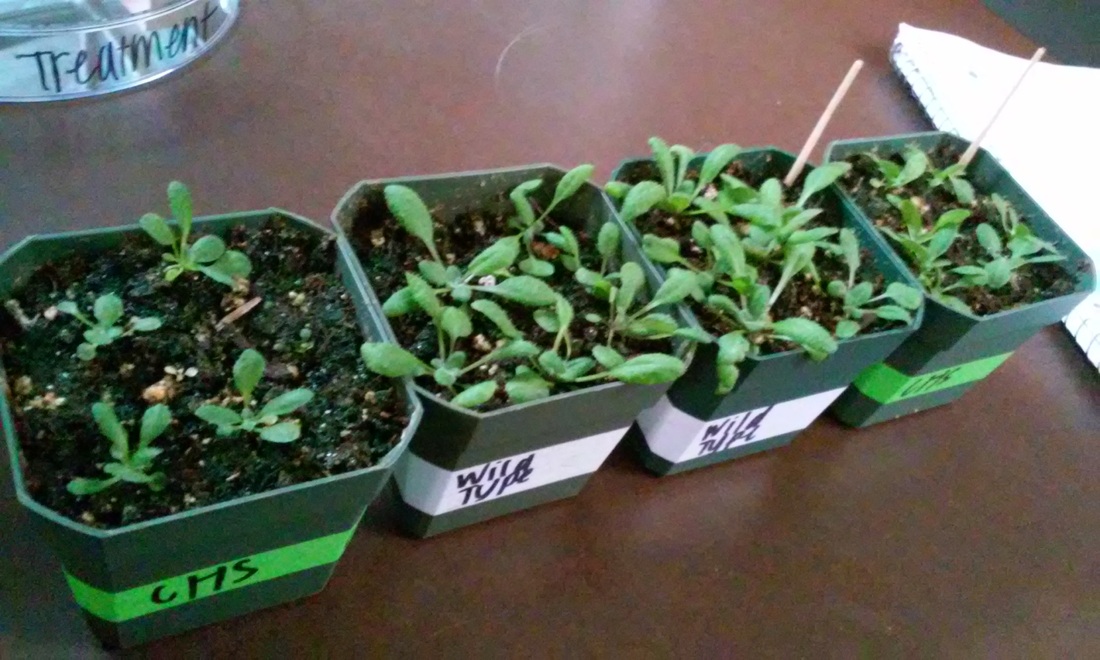
|
Figure 1 shows the relationship between the Wild Control rosette diameter and the Mutant Control rosette diameter. As you can see from the graph there was a significant difference between the two. This is important data to compare because it tells us that without treatment there already is a difference between the two plants.
Figure 2 shows the relationship between the Wild Experimental rosette diameter and the Wild Type Control rosette diameter. As you can see from the graph there wasn't much of a difference between the two. This is important data to compare because it tells us that the virus didn't seem to have a noticeable effect on the plant, as it still closely resembles the control, growing without the virus.
Figure 3 shows the relationship between the Wild Experimental rosette diameter and the Mutant Experimental rosette diameter. As you can see there does not seem to be a significant difference between the two plants in the beginning, but as time increases so does the difference between them. By the end of the data collection the difference increased quite significantly. This is very important data to observe and collected because it shows the overall effects of the CHS, and if it did indeed defend the plant against the virus. However, since in this graph the CHS Mutated plant seemed to do significantly worse, we do not believe that it did in our experiment.
Figure 4 shows the relationship between the Wild Experimental rosette diameter and the Wild Type Control bolt height. This is important comparison of our data because it shows that the Wild Type did not seem to be drastically effect by the virus. We do see a slight drop towards the end of the graph of the experimental height, and the control passing the experimental. But throughout the process they were pretty close in height, showing that the virus resulted in no significant change to the plant.
Figure 5 shows the plants on 11/5/2014. This was the first day of collecting data and as you can see the plants were still relatively small. At the time, the mutant plants still showed initial germination, while the Wild were a little further along.
Figure 6 shows the plants on 11/10/14. Just 5 days from the first photo. On this day it was very noticeable the difference between the two plants growth. The WIld Types were flourishing, growing thicker and quicker, while the mutated were still weak and flimsy. By now we had begun treatment and had yet to see any evidence of the virus on either plant.
Figure 7 shows the plants on 11/14/14. Just 9 days from the first photo. On this day the CHS plants were just slightly bigger than the plants were on the 11/5/2014 day. The Wild plants were quite large and began reaching the edge of the pot. This once again shows a significant difference in the two plants growth. On - there was a difference in the plants, but just slight. But by - there was a significant difference between the two. We were well into the treatment by now and still saw no evidence of the virus in the plants.
|
Conclusion
To determine if the CHS mutation did work as a defensive system for the plant against the virus we had to determine the effect of the gene and to set a baseline for what the plants should look like under normal conditions, as well as the effect of the treatment in both the difference between the experimentals and their controls as well as the difference between the two experimentals.
The effect of the gene mutation showed to be quite significant. Although it took the mutant longer to sprout, which must be taken into consideration, the overall growth rate of the mutated plant was much slower than that of the wild. This is observant in Figure 1 where it only took 18 days for the Wild Type to reach 40 mm, but it took the mutant type 32 days. That is twice the number of days, which can be classified as a significant difference in their growth. One that is most likely related to the mutation. Along with the growth difference we noticed that the plants phenotypes were slightly different from each other. The Wild Type was fuzzy on it’s leaves while the mutant was not. The wild also seemed to grow thicker, with wider leaves that were also a slightly darker shade of green when compared to the mutant. We hypothesize that these differences are due to the mutation, and that when the CHS mutation was turned on, other genes within the plant were turned off/on which caused these noticeable differences. Overall, we noticed that there was a difference between the two plants, showing that under normal conditions the Mutated Type is already significantly smaller than the Wild Type.
The differences between the experimental plants and their controls did not seem to be very apparent. We hypothesized that the Wild Type experimental and control would show the greatest difference, since originally the wild should thrive, but when under the treatment of the virus there should be signs of a struggle and sickness in the plant. However, no such observations were found. In fact the Wild Experimental was almost identical to it’s control. The only difference we found to be was that the Wild Type Experimental seemed to have a slightly larger rosette diameter from the Control. However, they were always very close together in growth. As seen in Figure 2, it took the Wild Type Experimental 14 days to reach 40mm, while it took the Wild Type Control 16 days, which is not significant was at 14 days and the Wild Type Control was at 16 days of growth when it hit 40mm. Another example is how long it took them to each reach 60mm. For the Wild Type Experimental it took 20 days and it took the Wild Type Control 21 days. Then on the 34th day the plants reached the same height. Since we suspected a rather significant difference between these two plants and received none, even in the phenotype of the plant, I suspect that the virus somehow did not reach the plant. Since the Mutated Experimental and the Mutated Control showed the same similar results and no signs of the virus, I suspect that it did not receive the virus, or at least enough of it to allow us to observe the effects.
Finally, while taking into consideration the previous conclusions we came to from our data, we determined that the difference between our two plants was significant, however we do not suspect it to be caused by the tobacco treatment. In fact, we stay strong to our hypothesis that it is due to the CHS mutation itself. We believe that the CHS mutation resulted in the plants to be smaller and with a slower growth rate. This is evident in that, it took the Wild 14 days to reach 40mm and it took the mutated plant until the 20th day to reach 40mm. Then for 50mm it took the Wild only until the 20th day, while it took the mutated until the 32nd day. This is a significant difference between the two plants, which may have been a result of the Tobacco treatment, but since the plants phenotype showed no results when we expected it to, I believe that the difference is simply because of the mutation.
Overall we found no significant evidence of the Tobacco Mosaic Virus in the plants, and that the significant difference evident in our data is due to the CHS mutation itself. With the data collected our original question of, if CHS works well as a defensive mechanism against virus, can not be determined as we do not suspect that the virus was ever effecting our plants. However, from this experiment we were able to come to the conclusion that the CHS mutation in plants leaves them very vulnerable and hard to maintain. I suspect that when the two plants, both CHS Mutated and the Wild type, are both being affected by the virus the CHS will then thrive and be very useful. However, under normal conditions, since at the end of our experiment you can see a drop is the heights of the plants, and the overall observations of the plants showed a significant toll on their health (possibly due to the virus finally taking part in the mutated plants, or simply nature), and the overall observations of the plants, they seem very risky to use as they seem to be very hard to maintain. After this experiment alone I would advise not to use the CHS mutation as it seems to be replacing a risk with another risk. However, I would not advise making such decision without completing the experiment multiple times.
If I were to complete the experiment again I would topwater with the tobacco instead of bottom water. I suspect that this made it hard for the virus to get to the plant and is why we didn’t see any results. I would also have increased the tobacco to water solution from .5 gram tobacco per 4o oz water to .75 grams tobacco per 5o oz water and water them more often. I also would have observed the plants for a longer time, changing the whole watering situation every 2 weeks (enough time to see the results the current watering system had on the plants) until I found a watering system that allowed the plants to receive the virus, but not so much that it kills them. Once I found that correct watering system I would continue to take observations for a few more weeks before I ended the experiment, reflected on that one, and would start again this time using the proven watering system throughout the entire experiment. I find that this is the only way to ensure that the change or the decision not to modify our plants to have the CHS mutation can be determined.
Links to Sources
http://www.plantphysiol.org/content/144/3/1520.full
http://link.springer.com/article/10.1007/BF00392185#page-1
http://www.ncbi.nlm.nih.gov/pmc/articles/PMC159807/pdf/010707.pdf
http://www.ncbi.nlm.nih.gov/pmc/articles/PMC3148432/
http://www.ncbi.nlm.nih.gov/pmc/articles/PMC2899912/
http://mbe.oxfordjournals.org/content/19/10/1752.full
http://www.plantphysiol.org/content/144/3/1520.full
http://onlinelibrary.wiley.com/doi/10.1046/j.1365-313X.1996.09010063.x/pdf
http://www.plantcell.org/content/18/1/225.full
http://www.ncbi.nlm.nih.gov/pmc/articles/PMC2899912/
http://mbe.oxfordjournals.org/content/19/10/1752.full
http://www.pnas.org/content/85/18/6738.full.pdf
http://www.ncbi.nlm.nih.gov/pmc/articles/PMC116467/
http://ec.asm.org/content/7/1/112.full
